Data Analytics
Comprehensive data pipelines, exploratory analysis and visualisation solutions for data-driven organisations.
Project Lifecycle Approach
Business Metric Mapping
Consult stakeholders to identify operational KPIs and analytics requirements.
Data Source Integration
Consolidate ingestion pipelines from databases, CRM systems, webhooks, and third-party APIs.
ETL / ELT Engineering
Develop secure extraction, loading, and transformation scripts using dbt, Spark, or custom pipelines.
Data Warehouse Modeling
Design star/snowflake warehouse structures optimized for lightning-fast query execution.
Exploratory Data Analysis
Run correlation tests, detect data anomalies, and isolate seasonal variance factors.
Predictive Modeling Setup
Incorporate forecasting models (ARIMA, Prophet) and customer segmentation cluster analytics.
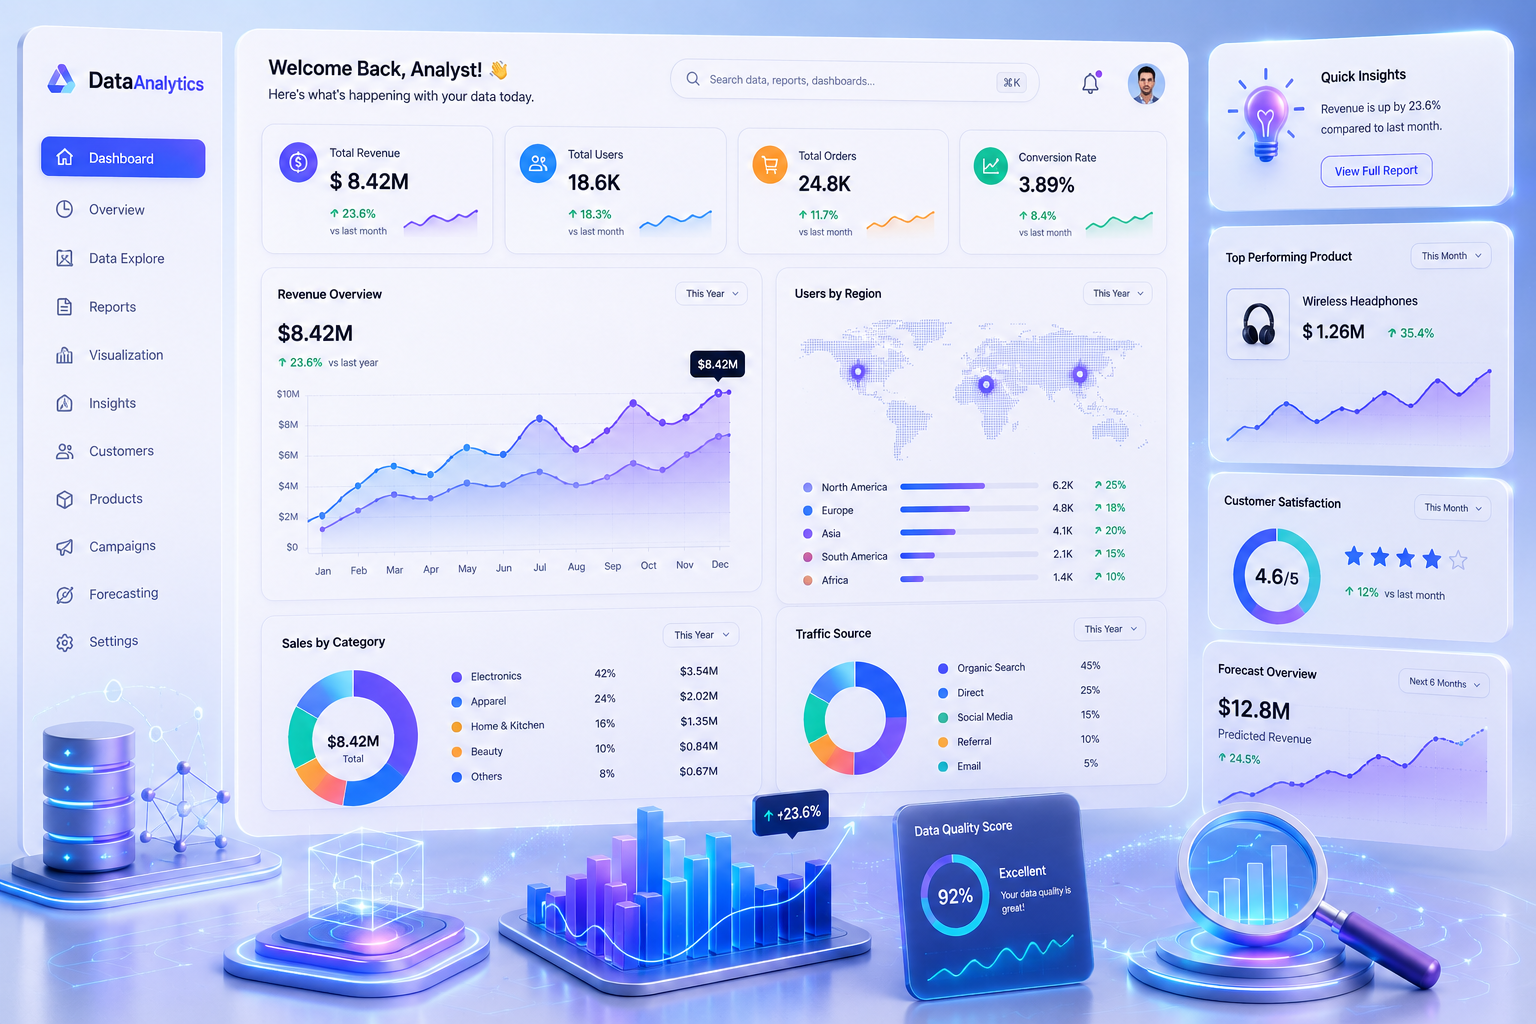
Interactive Dashboard Design
Build custom real-time visual dashboards with clean typography and filter controls.
Anomaly Alerting Rules
Create automated trigger channels on Slack or email when metrics drop beyond safety thresholds.
Data Access Governance
Enforce row-level security and role-based permissions to comply with GDPR and HIPAA.
Executive Briefing & Audits
Deliver detailed summary briefs and continuous dashboard reviews to optimize business decisions.
Ready to build a Data Analytics solution?
Let's scope your project in a free 30-minute call.
Book Free Consultation